使用 Kiali 可视化 Kmesh 下的流量图
准备工作
-
使默认命名空间由 Kmesh 管理。
-
部署 bookinfo 作为示例应用程序,并部署 sleep 作为 curl 客户端。
-
[可选] 为服务
reviews安装服务粒度的 waypoint。
以上步骤可参考 安装 Waypoint | Kmesh。在安装 Istio 时,我们建议安装 Istio 的 ambient 模式,而不是仅安装 Istiod,因为 Kiali 目前依赖 Istio 组件才能正常工作。 -
部署 Prometheus 来记录 Kmesh 指标,并将其转换为 Istio 标准指标。
此 Prometheus 插件利用 Prometheus 记录规则和重新标记配置,将 Kmesh 的 L4 指标转换为 Istio 标准指标,以便 Kiali 能够可视化这些指标。kubectl apply -f https://raw.githubusercontent.com/kmesh-net/kmesh/main/samples/addons/prometheus_recording_istio.yaml -
部署 Kiali,从 Prometheus 读取指标。
kubectl apply -f https://raw.githubusercontent.com/kmesh-net/kmesh/main/samples/addons/kiali.yaml
在网格中的应用程序之间生成一些持续的流量
kubectl exec deploy/sleep -- sh -c "while true; do curl -s http://productpage:9080/productpage | grep reviews-v.-; sleep 1; done"
使用 Kiali 可视化服务的流量图
-
使用 port-forward 命令将流量转发到 Kiali。
kubectl port-forward --address 0.0.0.0 svc/kiali 20001:20001 -n kmesh-system
Forwarding from 0.0.0.0:20001 -> 20001 -
从浏览器查看 Kiali 中的流量图。
访问Traffic Graph面板。在左侧顶部选择default命名空间。
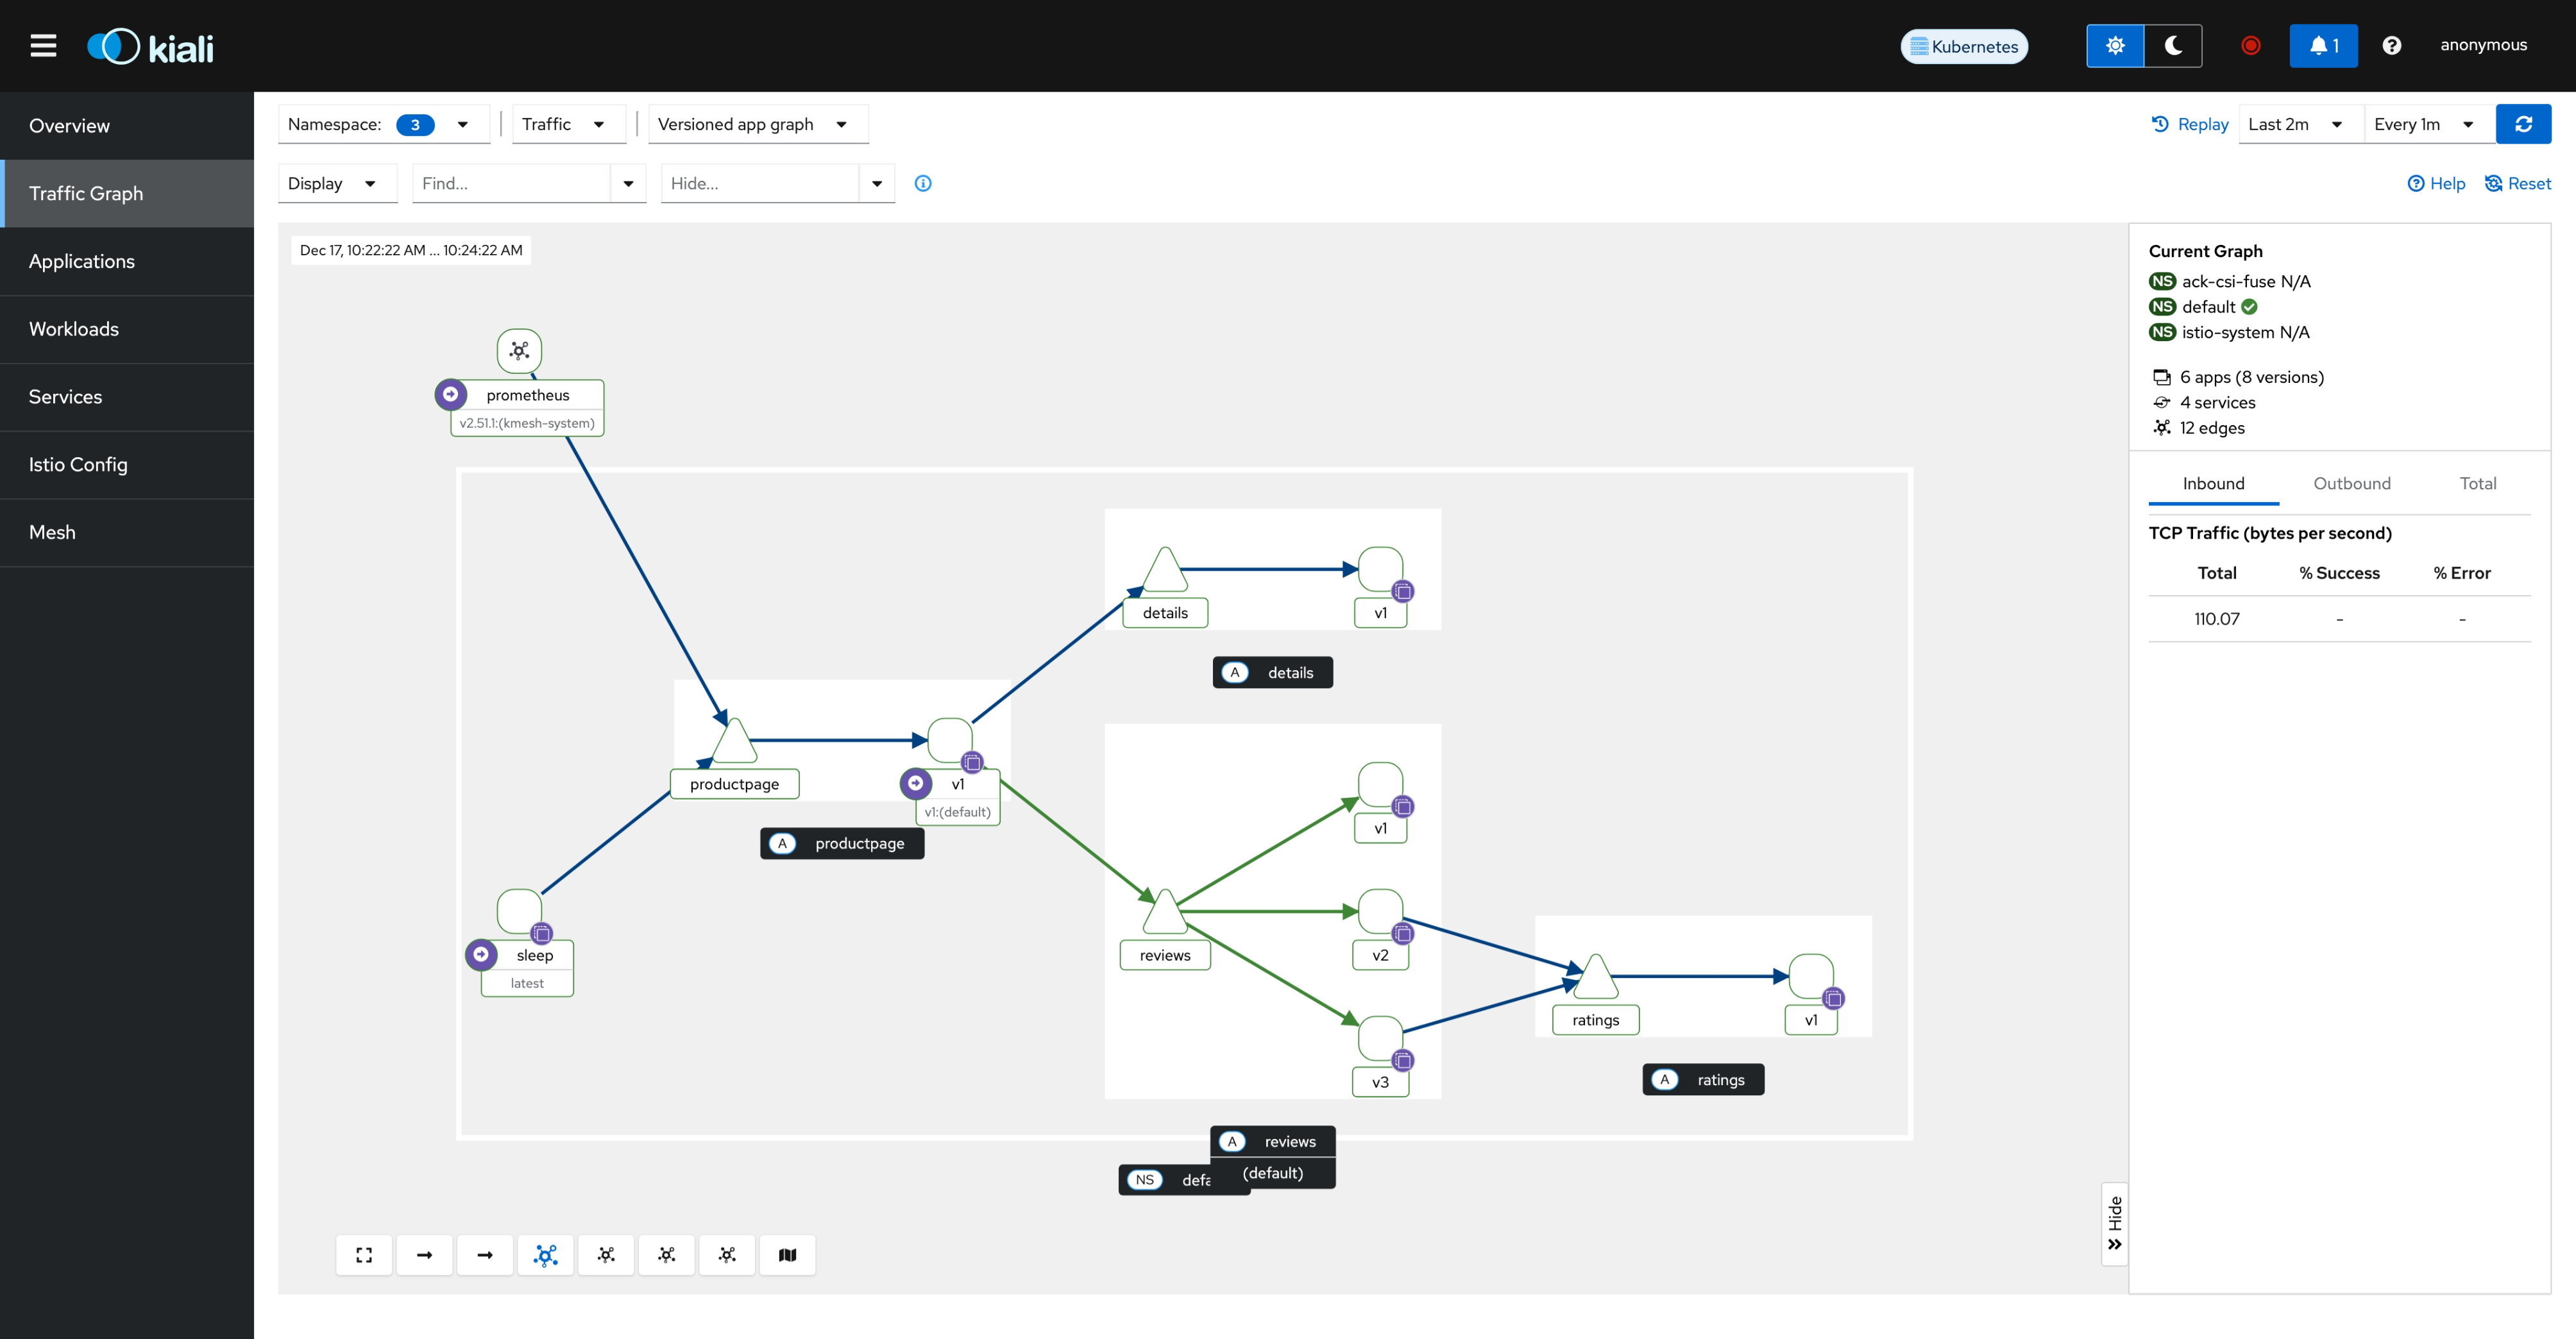
在此流量拓扑图中,蓝色线条代表 TCP 流量,由 Kmesh 代理,而绿色线条代表 HTTP 流量,由 Waypoint 代理。有关 Kiali 流量拓扑图的更多信息,请参阅 Kiali 文档。
清理
-
移除 Prometheus 和 Grafana:
kubectl delete -f https://raw.githubusercontent.com/kmesh-net/kmesh/main/samples/addons/prometheus_recording_istio.yaml
kubectl delete -f https://raw.githubusercontent.com/kmesh-net/kmesh/main/samples/addons/kiali.yaml -
如果您不打算探索任何后续任务,请参考 安装 Waypoint/清理 说明来移除 waypoint 并关闭应用程序。
This translation ensures that the document is accessible to Chinese-speaking users while maintaining the technical integrity of the original content.