Kmesh Performance
Observability Integrations
Kmesh provides comprehensive monitoring capabilities through integration with industry-standard observability platforms:
- Prometheus: Collects and stores metrics for Kmesh performance and operations
- Grafana: Visualizes Kmesh metrics through customizable dashboards
- Jaeger: Enables distributed tracing to analyze service mesh traffic patterns
These integrations help monitor Kmesh's performance metrics, resource consumption, and traffic patterns in real-time.
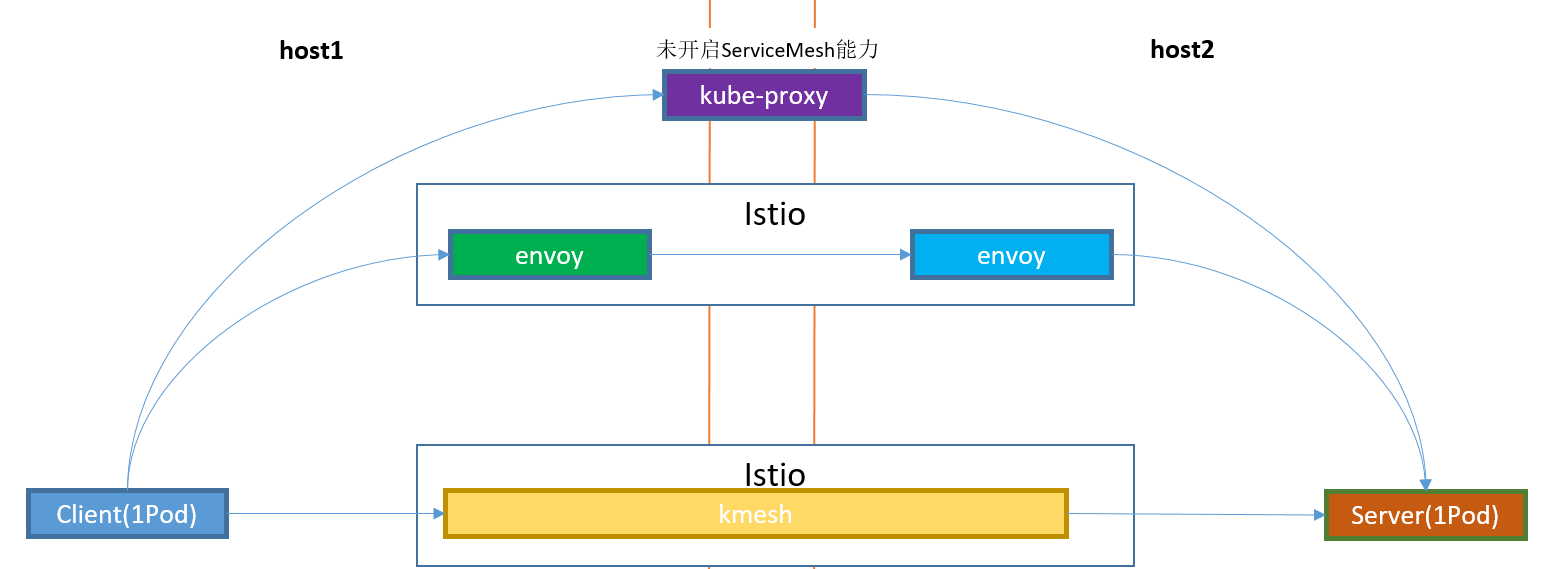
Test Network Setup
How We Test
Testing Tools
Kmesh uses two main testing tools:
- Fortio: A microservice load testing tool that measures:
- Latency (TP90, TP99)
- Throughput (QPS)
- Dstat: A system monitoring tool that tracks CPU usage during tests
Test Method
Test a group of fortio performance data by using the number of concurrent connections as a variable parameter, and collect the CPU usage during the test. The test script has been archived.
Running the Tests
#Preparing the test environment
[root@perf]# ./fortio_perf.sh
# Generate a CSV table of test results in the directory.
[root@perf]# ll
-rw-r--r--. 1 root root 6.1K Nov 5 17:39 fortio_perf_test.csv
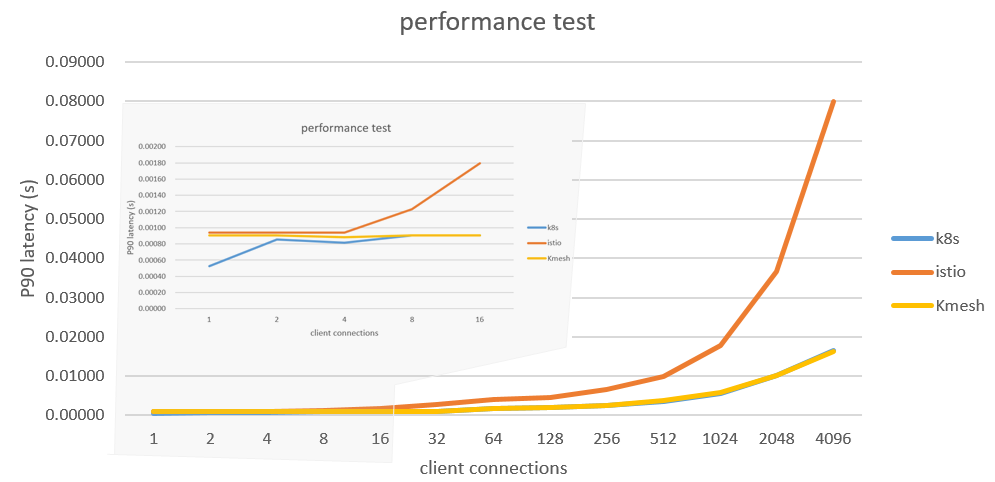
Performance Results