Use Grafana to visualize service metrics
Preparation
-
Make default namespace managed by Kmesh
-
Deploy bookinfo as sample application and sleep as curl client
-
Install namespace granularity waypoint for default namespace
The above steps could refer to Install Waypoint | Kmesh
- Deploy prometheus and garafana:
[root@ ~]# kubectl apply -f https://raw.githubusercontent.com/kmesh-net/kmesh/main/samples/addons/prometheus.yaml
[root@ ~]# kubectl apply -f https://raw.githubusercontent.com/kmesh-net/kmesh/main/samples/addons/grafana.yaml
Generate some continuous traffic between applications in the mesh
[root@ ~]# kubectl exec deploy/sleep -- sh -c "while true; do curl -s http://productpage:9080/productpage | grep reviews-v.-; sleep 1; done"
Use grafana to visualize service metrics
- Use the port-forward command to forward traffic to grafana:
[root@ ~]# kubectl port-forward --address 0.0.0.0 svc/grafana 3000:3000 -n kmesh-system
Forwarding from 0.0.0.0:3000 -> 3000
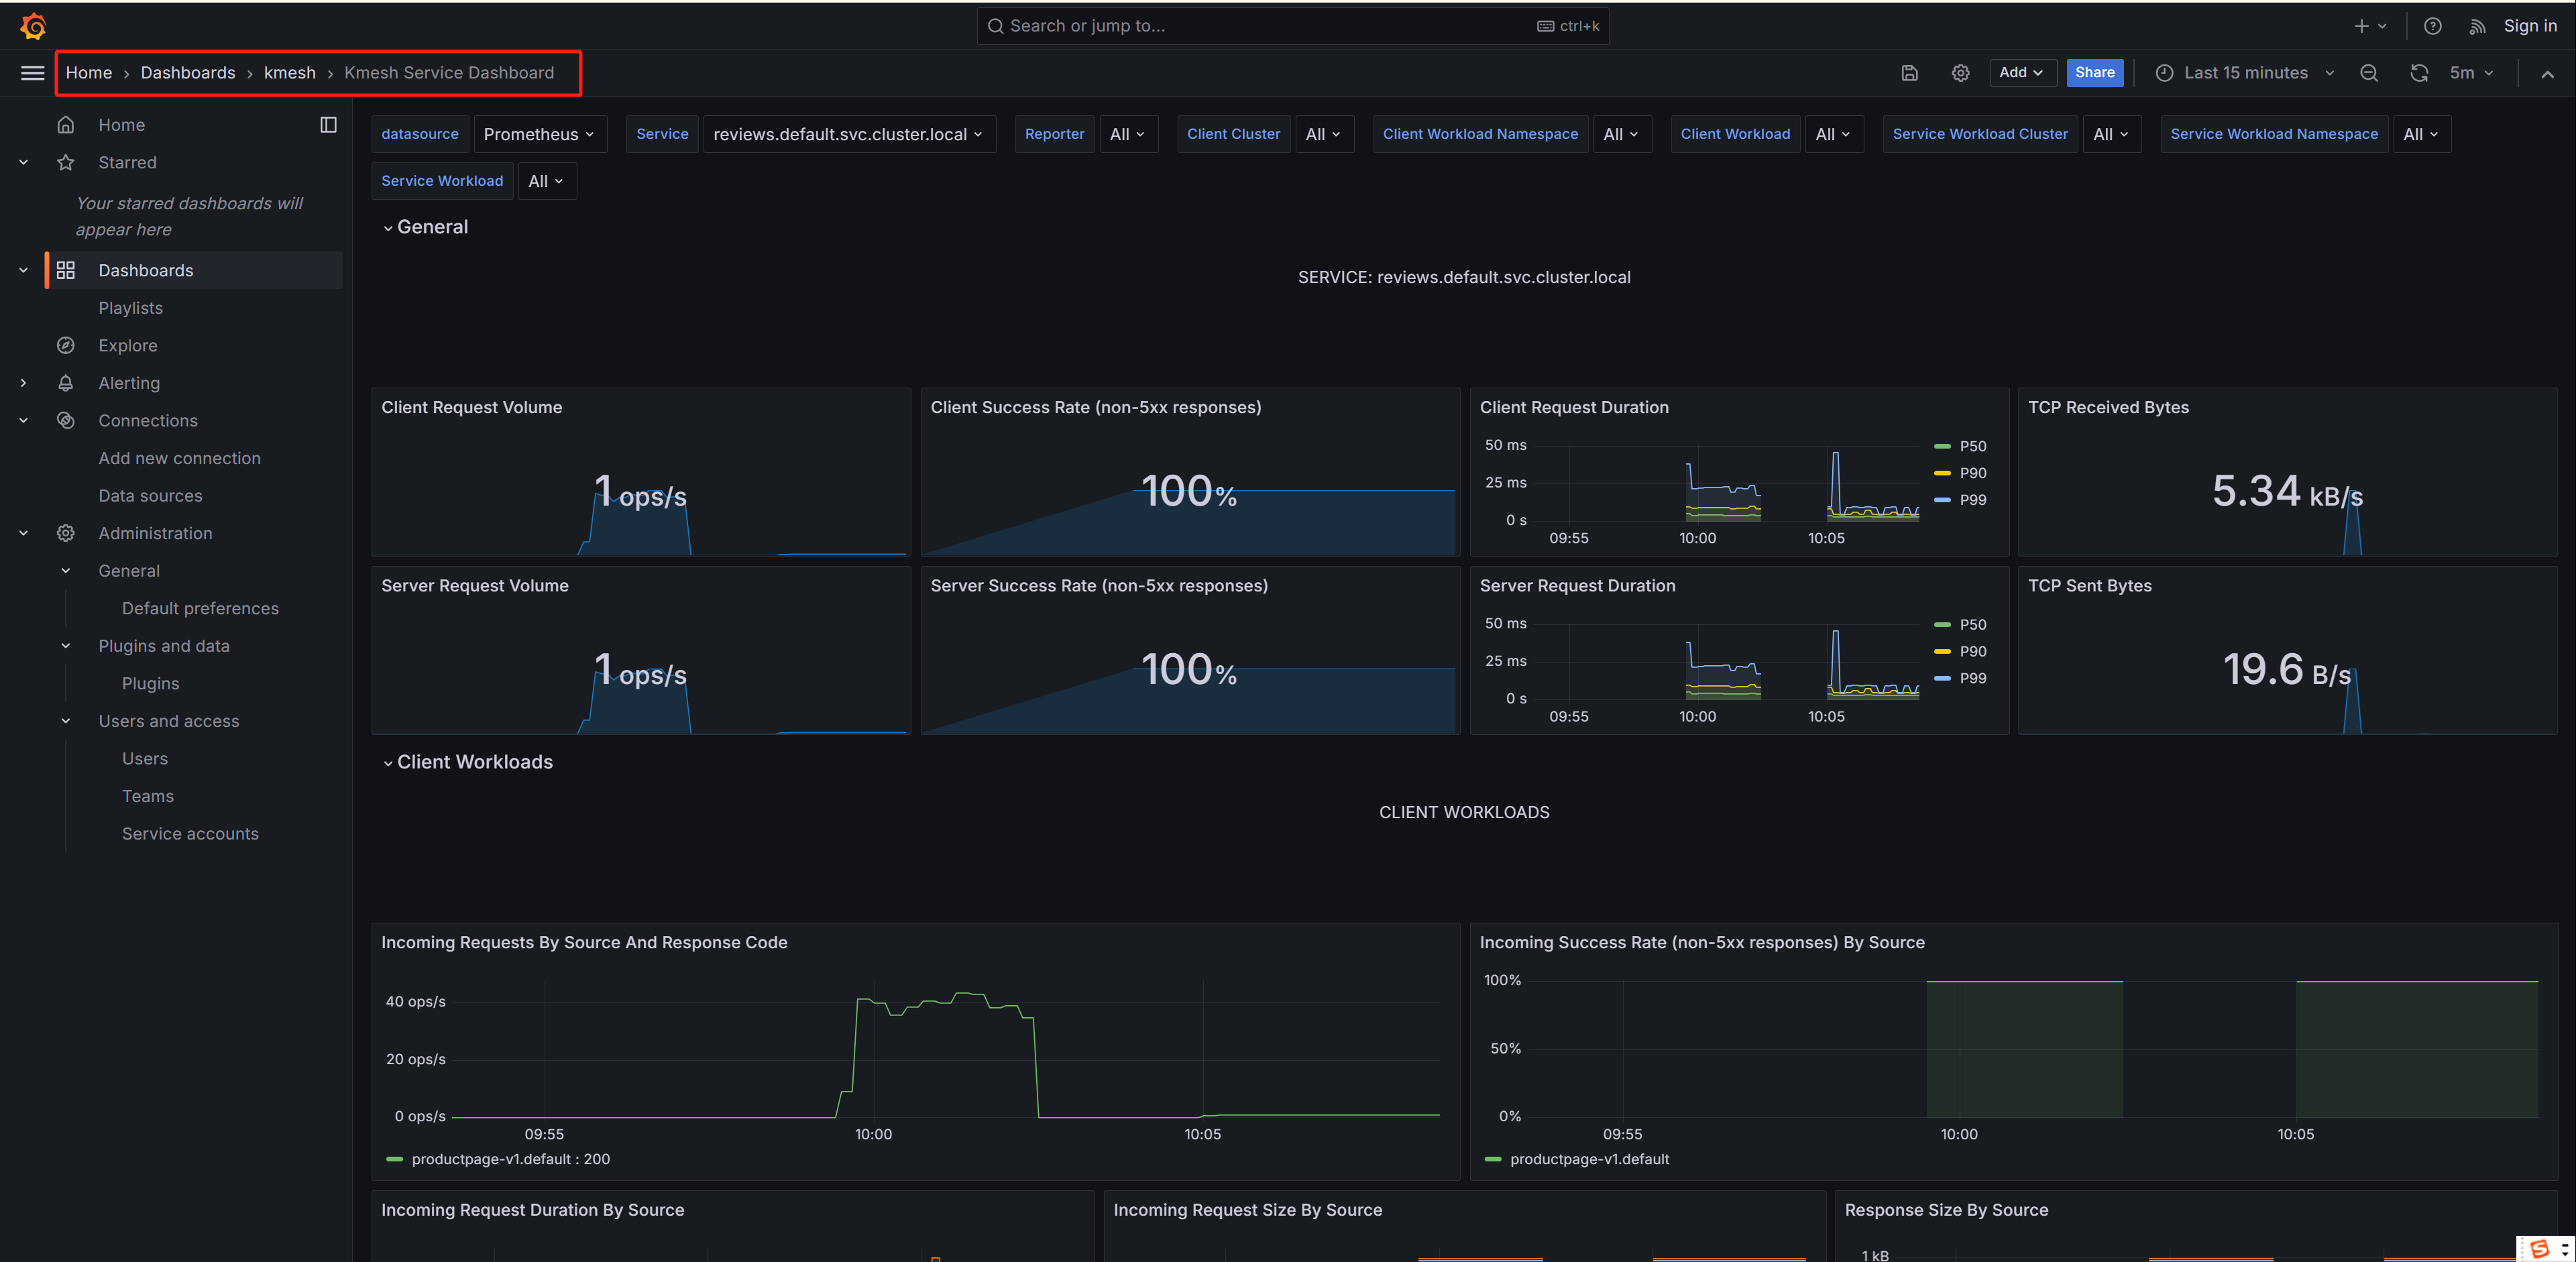
- View the dashboard from browser
Visit Dashboards>Kmesh>Kmesh Service Dashboard:
Cleanup
- Remove prometheus and grafana:
[root@ ~]# kubectl delete -f https://raw.githubusercontent.com/kmesh-net/kmesh/main/samples/addons/prometheus.yaml
[root@ ~]# kubectl delete -f https://raw.githubusercontent.com/kmesh-net/kmesh/main/samples/addons/grafana.yaml
- If you are not planning to explore any follow-on tasks, refer to the Install Waypoint/Cleanup instructions to remove waypoint and shutdown the application.